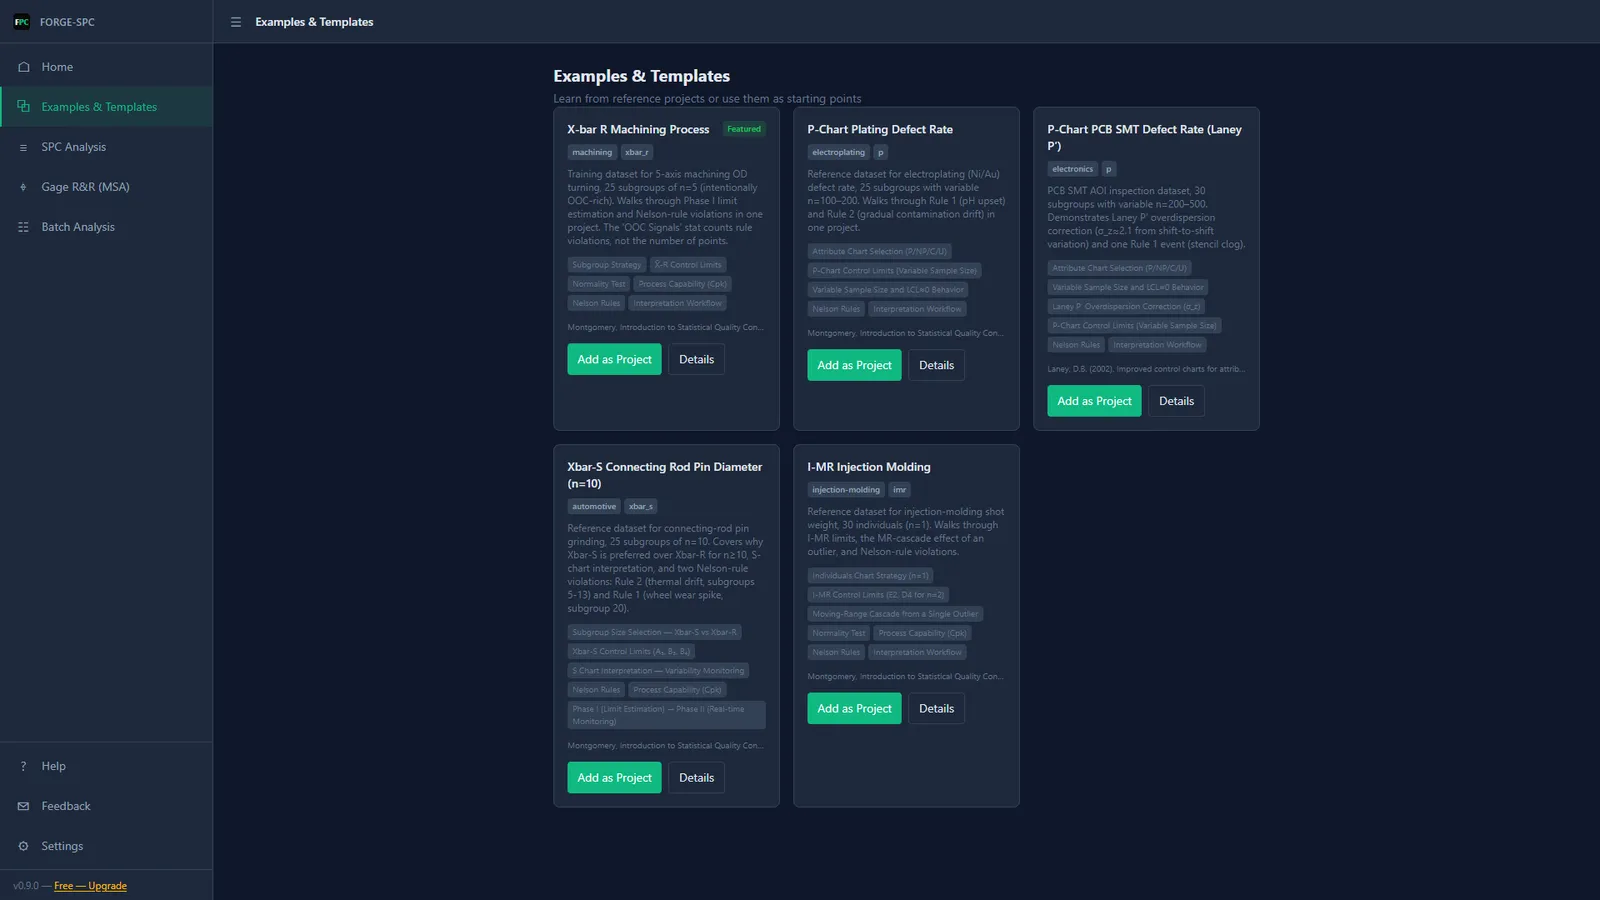
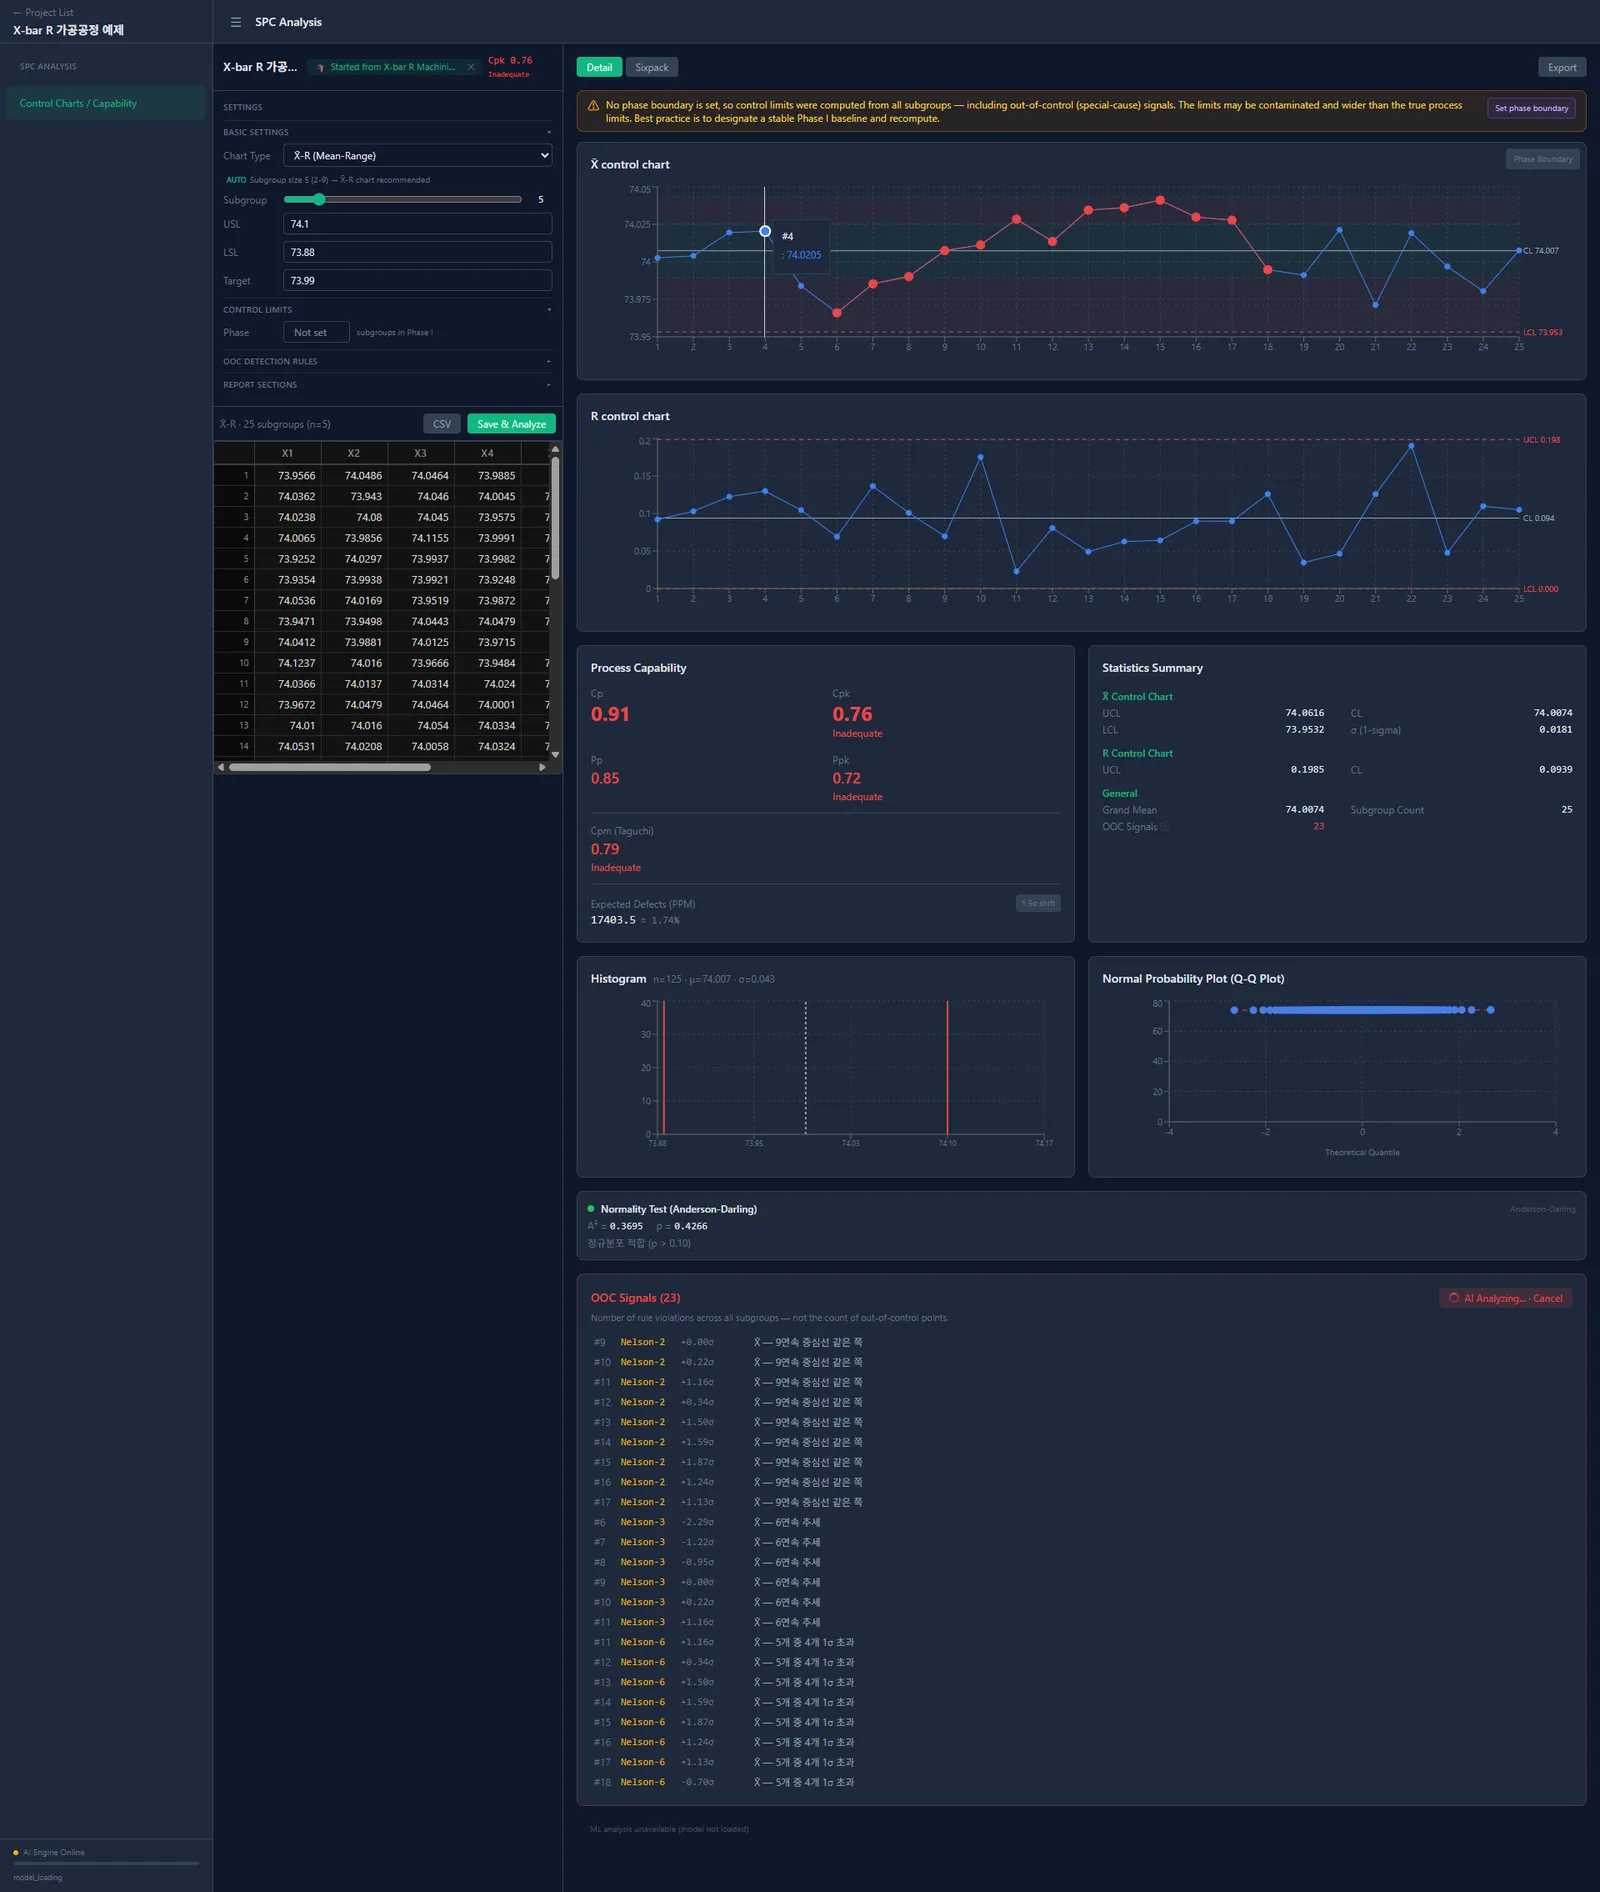
Forge SPC
AI Statistical Process Control desktop app for quality engineers. 9 control charts (X̄-R, X̄-S, I-MR, P, NP, C, U, CUSUM, EWMA), Cp/Cpk/Pp/Ppk/Cpm capability with Box-Cox for non-normal data (ISO 22514-2), AIAG MSA 4th Edition Gage R&R (ANOVA + X̄-R), Nelson 8 rules, ML pattern recognition with SR-CNN anomaly detection, local LLM 6M root-cause estimation. NIST StRD-verified accuracy. SPC → FMEA (Occurrence) / 8D (anomaly events) / SOP (reaction plans) .fex integration. Fully offline.
Key Features
Professional SPC toolkit that replaces expensive subscription software.
9 Control Charts
X̄-R, X̄-S, I-MR, P, NP, C, U, CUSUM, and EWMA. Zone A/B/C coloring, Phase I/II separation, auto chart-type recommendation, and real-time recalculation.
Process Capability
Cp, Cpk, Pp, Ppk, Cpm (Taguchi) with PPM estimates. Box-Cox transformation for non-normal data (ISO 22514-2). Histogram, Q-Q Plot, Shapiro-Wilk, and Capability Sixpack.
Gage R&R (MSA)
AIAG MSA 4th Edition Gage R&R (Crossed). X̄-R and ANOVA methods, 6 diagnostic charts, interaction pooling, and GRR/PV/TV/ndc results. Part × Operator × Trial data entry.
ML Pattern Recognition
Machine learning classifies 8 control chart patterns (trend, shift, cycle, stratification, etc.) and SR-CNN detects time-series anomalies. Beyond rule-based detection.
AI Root-Cause Estimation
Local LLM analyzes OOC signals with 6M framework context and ML pattern hints to suggest probable root causes. Runs entirely offline — no data leaves your machine.
Nelson 8 Rules
Automatic out-of-control detection with all 8 Nelson rules. Visual highlighting on charts, detailed signal descriptions, subgroup notes, and OOC detail popovers.
Cross-App Integration
Export Cpk data to Forge FMEA for occurrence quantification. Send OOC events to Forge 8D as problem triggers. Reaction plans to Forge SOP. All via .fex file exchange.
NIST-Verified Accuracy
All statistical calculations verified against NIST Standard Reference Datasets (StRD). 38 tests across 9 certified datasets covering lower to higher difficulty levels.
PDF & Excel Export
Professional PDF reports with charts, statistics, and capability indices. Multi-sheet Excel workbooks. Excel import with column mapping and stacked/unstacked auto-detection.
Multi-Project Comparison
Overlay control charts from multiple projects for cross-process comparison. Cpk bar chart, X̄/R overlay, per-project capability cards.
Real-time Preview
Instant Cpk and control limits as you enter data. Rust WASM statistics engine calculates without IPC delay. Inline Cpk badge in data entry panel.
Pricing
Try every feature for free. License removes all limits.
All SPC features including AI and ML — with project limits.
- All 9 control chart types
- Cp/Cpk/Pp/Ppk/Cpm capability
- ML pattern recognition & anomaly detection
- AI root-cause estimation
- 3 projects / 50 subgroups per project
- Watermarked PDF & Excel output
Unlimited projects, data, and professional output.
- Unlimited projects & subgroups
- Gage R&R (ANOVA + X̄-R)
- No watermark on reports
- Excel import with column mapping
- Cross-app .fex data exchange
- Custom branding & report layout