 Forge Tools BlogForge Tools
Cpk vs Ppk: what each index measures, and what the gap between them tells you
Cpk and Ppk use the same formula and the same specification limits. They differ in one thing only — which standard deviation goes into the denominator — and that one difference makes them answer two different questions:
- Cpk — what is this process capable of when only common-cause variation is present?
- Ppk — what did this process actually deliver over the period the data covers?
When the two agree, the process is stable and the answer is simple. When they disagree, the size of the gap is itself the finding.
The formulas
For a characteristic with lower and upper specification limits LSL and USL and a process mean μ:
| Potential (centering ignored) | Actual (centering included) | |
|---|---|---|
| Capability — short-term σ̂ | Cp = (USL − LSL) / 6σ̂within | Cpk = min(USL − μ, μ − LSL) / 3σ̂within |
| Performance — overall s | Pp = (USL − LSL) / 6soverall | Ppk = min(USL − μ, μ − LSL) / 3soverall |
The two spreads:
- σ̂within estimates variation inside rational subgroups — parts made close together in time, under the same conditions. From an X̄-R chart it is R̄ / d₂; for individual measurements it is MR̄ / d₂ with d₂ = 1.128 (moving ranges of two consecutive points). Shifts and drifts between subgroups are, by construction, left out.
- soverall is the ordinary sample standard deviation of every measurement. Whatever moved the process during the data period — a tool change, a new material lot, a mold warming up — is in it.
Because the numerators are identical, Cp / Pp = soverall / σ̂within — and so is Cpk / Ppk whenever both use the same mean. A Cp far above Pp says the overall spread is far wider than the short-term spread: something is moving the process between subgroups.
Which one to report
- Cpk presumes a stable process. σ̂within predicts future output only if the process stays as it was while the subgroups were collected, so the AIAG SPC manual treats capability indices as meaningful only for a process in statistical control. Check the control chart before quoting Cpk.
- Ppk describes the data you have, stable or not. That makes it the natural index for a short initial run, where there has not been time to establish control.
- Customers often ask for both. In automotive production part approval (AIAG PPAP), the initial process study is judged on Ppk (or Cpk for stable processes): an index above 1.67 meets the acceptance criterion, 1.33–1.67 may be acceptable with the customer's agreement, and below 1.33 does not meet it.
Reading the gap
| What you see | What it usually means |
|---|---|
| Cpk ≈ Ppk, both high | Stable and capable. |
| Cpk high, Ppk low | Capable in the short term, not stable. Special causes (shifts, drifts, outliers) are consuming the tolerance. Fix those before tightening anything. |
| Both low, close together | Stable but not capable: the common-cause spread itself is too wide for the tolerance. Reducing it needs a change to the process, not better control of it. |
| Cp high, Cpk much lower | The spread fits the tolerance; the mean is off-center. Often the cheapest improvement available. |
| Ppk above Cpk | Unusual. Suspect subgroups that are not rational (mixed streams inflating R̄), over-adjustment between parts, or too little data for either estimate to be stable. |
Two cautions that apply to both indices: they assume the measurements are roughly normal (check with a normality test or a histogram before reading them as fraction-defective), and with a few dozen measurements their sampling uncertainty is large — a Ppk of 1.33 from 30 parts is not meaningfully different from 1.2.
A worked example: Cpk 1.67, Ppk 0.89
Thirty injection-molded parts, one per shot, nominal 25.00 g with LSL 24.80 and USL 25.20. Shots 1–15 were made at a stable mold temperature; the temperature then changed and shots 16–24 ran heavier; shot 28 was a single heavy part.
- Using shots 1–15 as the stable baseline, σ̂within = MR̄ / 1.128 = 0.0371 g, giving Cp 1.80, Cpk 1.67.
- The overall standard deviation of all 30 parts, shift and outlier included, is 0.065 g, giving Pp 1.03, Ppk 0.89.
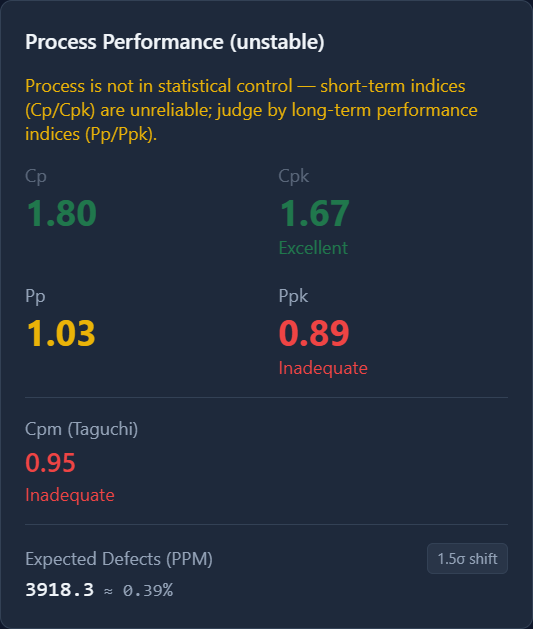
Both numbers are correct. The molding process can hold this tolerance comfortably; over these 30 shots it did not, because of the temperature shift and the heavy part. The ratio of the spreads, 0.065 / 0.0371 ≈ 1.75, is the ratio Cp / Pp = 1.80 / 1.03 — the special causes widened the effective spread by three quarters. (Cpk / Ppk is larger still, 1.88, because Ppk is also centered on the overall mean, which the shift pulled toward the USL.) The right response is to remove them, not to widen the tolerance or to accept the process on the strength of its Cpk.
Note what happens if the baseline is skipped and the limits are computed from all 30 shots: the shift inflates the moving ranges, and Cpk drops to 1.11. Contaminated limits make short-term capability look worse and the stability problem look smaller than they are.
Try it in Forge SPC
The example above ships with Forge SPC as the I-MR Injection Molding project. Forge SPC shows Cp, Cpk, Pp and Ppk side by side, dims the capability indices when the chart is out of control, and overlays both the within and overall normal curves on the histogram. The step-by-step walkthrough — setting the Phase I baseline, reading the Nelson rule signals, and comparing the indices — is in the I-MR chart guide.
Forge SPC runs on your own PC, offline; the data never leaves it.
References
- AIAG, Statistical Process Control (SPC) Reference Manual, 2nd ed., 2005 — process capability and process performance for variables data.
- AIAG, Production Part Approval Process (PPAP), 4th ed., 2006 — acceptance criteria for initial process studies.
- ISO 22514-2:2017, Statistical methods in process management — Capability and performance — Part 2: Process capability and performance of time-dependent process models.
- D. C. Montgomery, Introduction to Statistical Quality Control, Wiley — process and measurement system capability analysis.